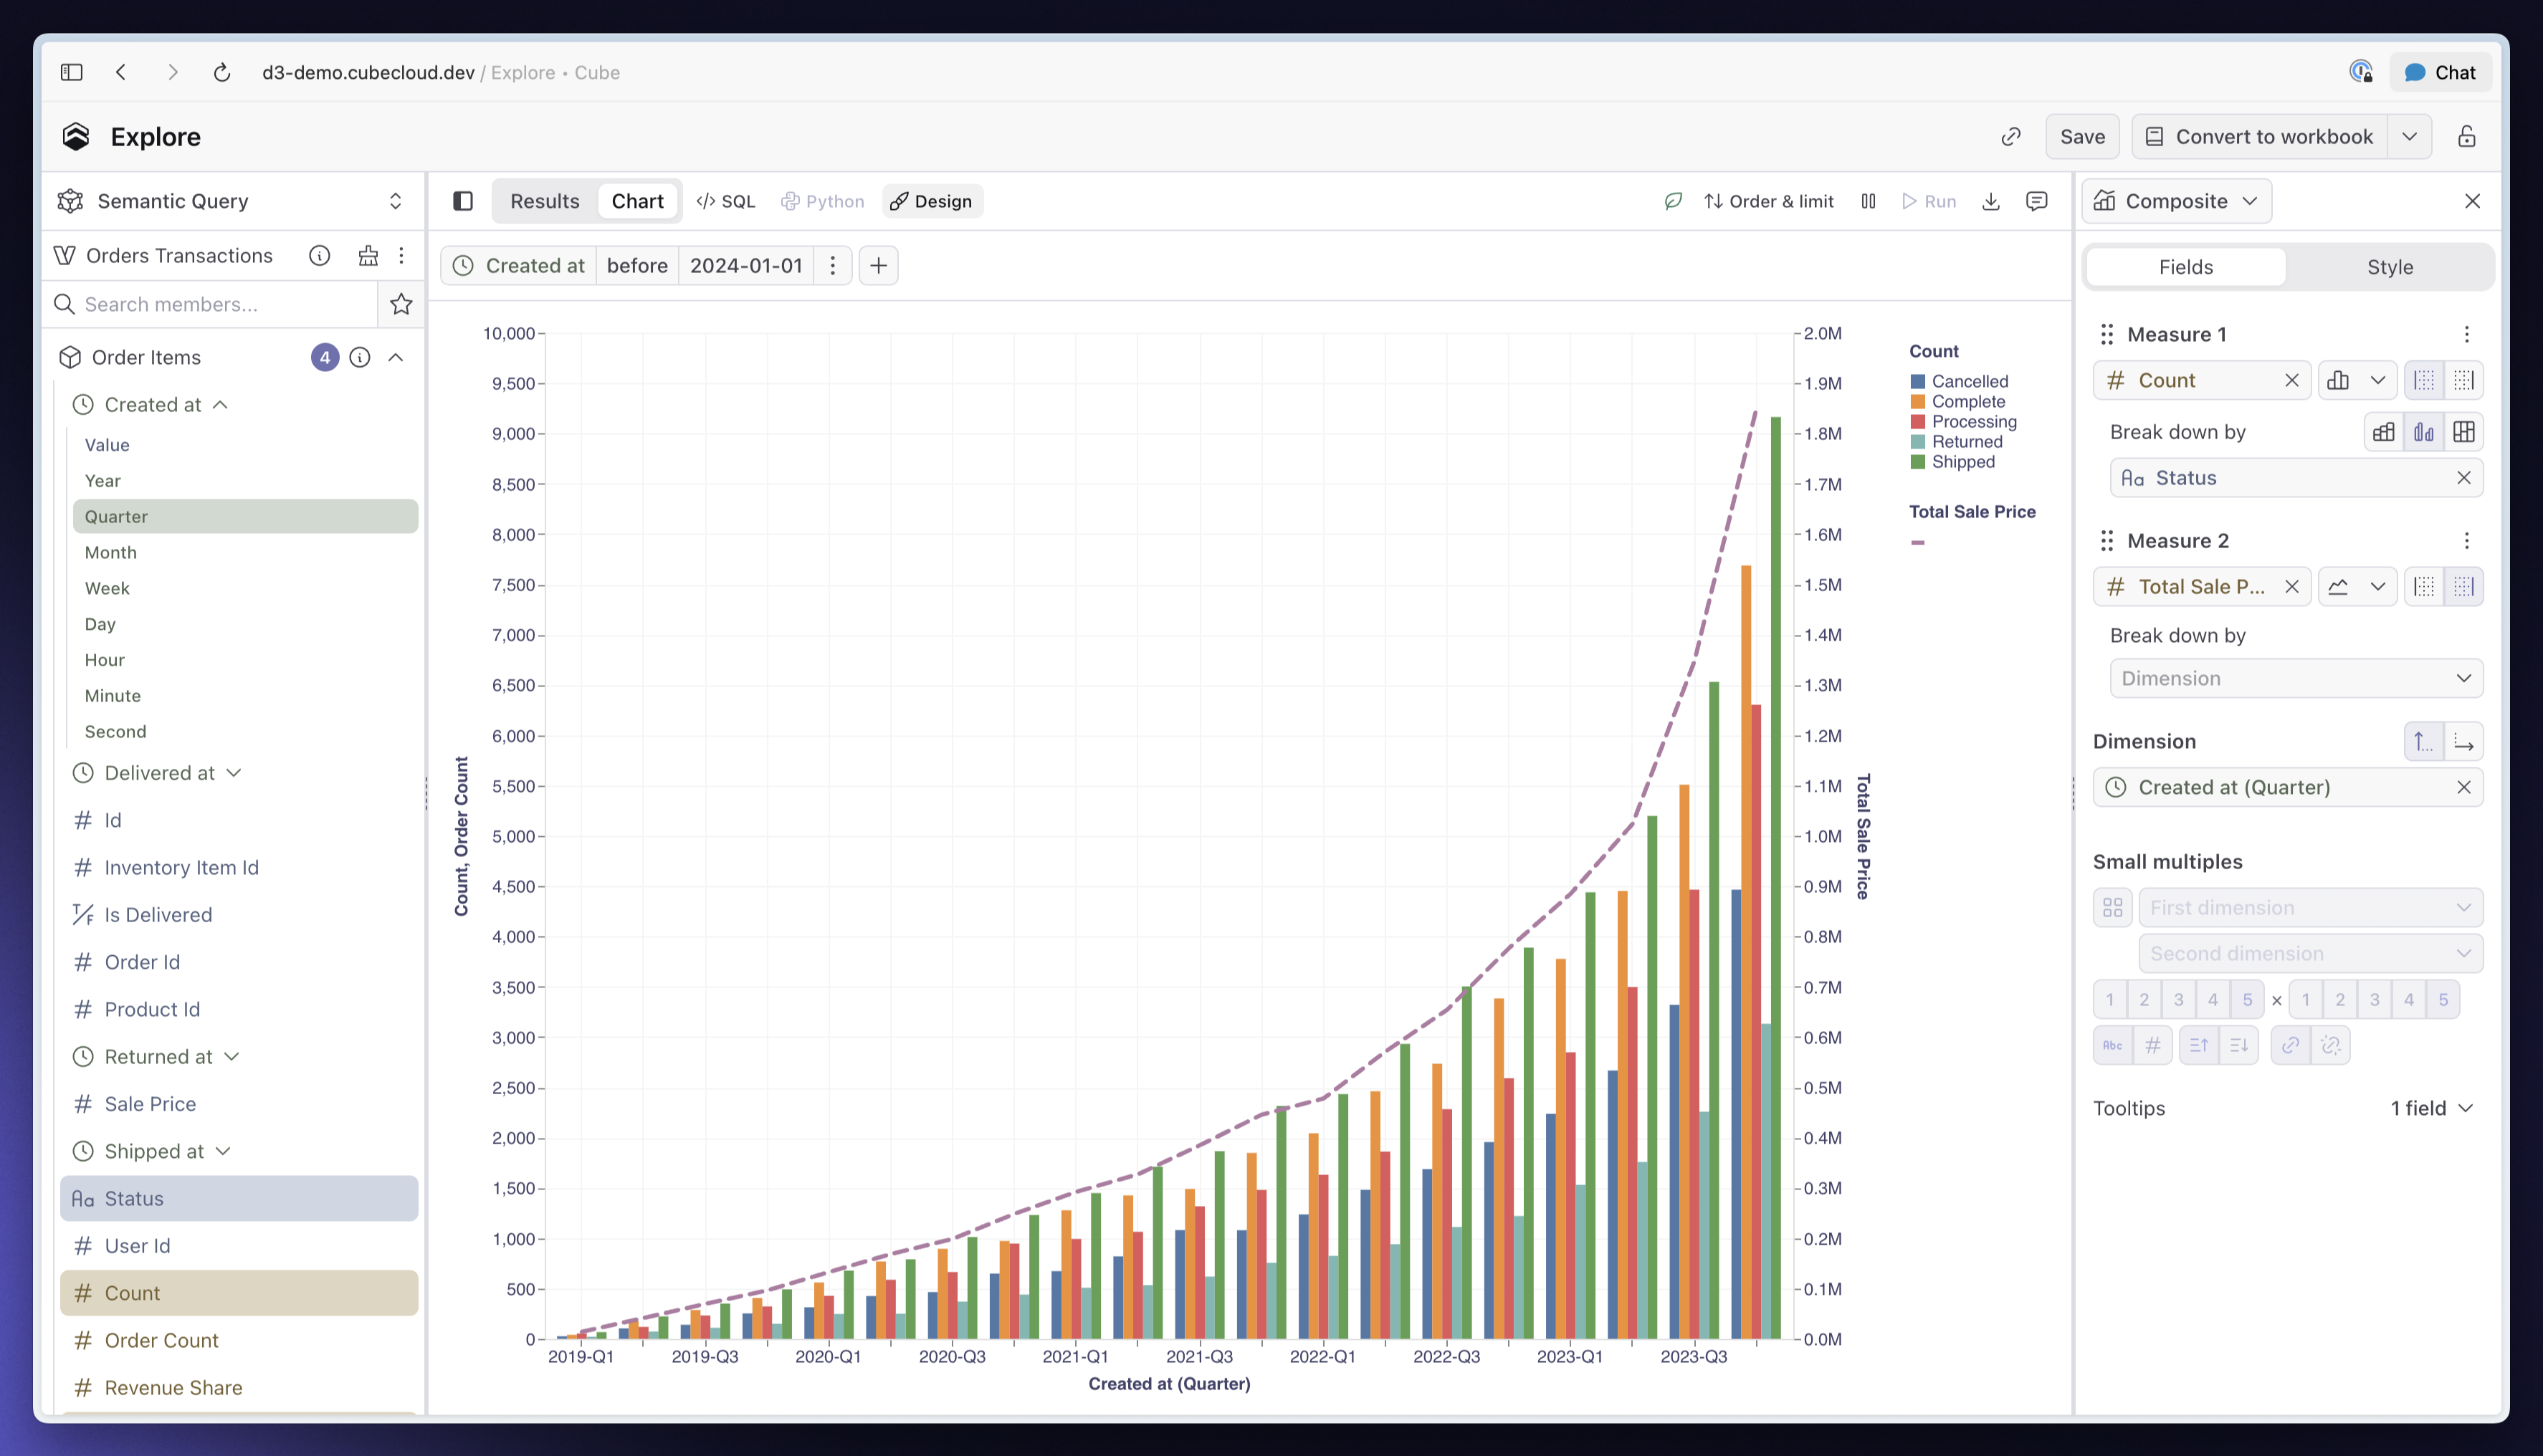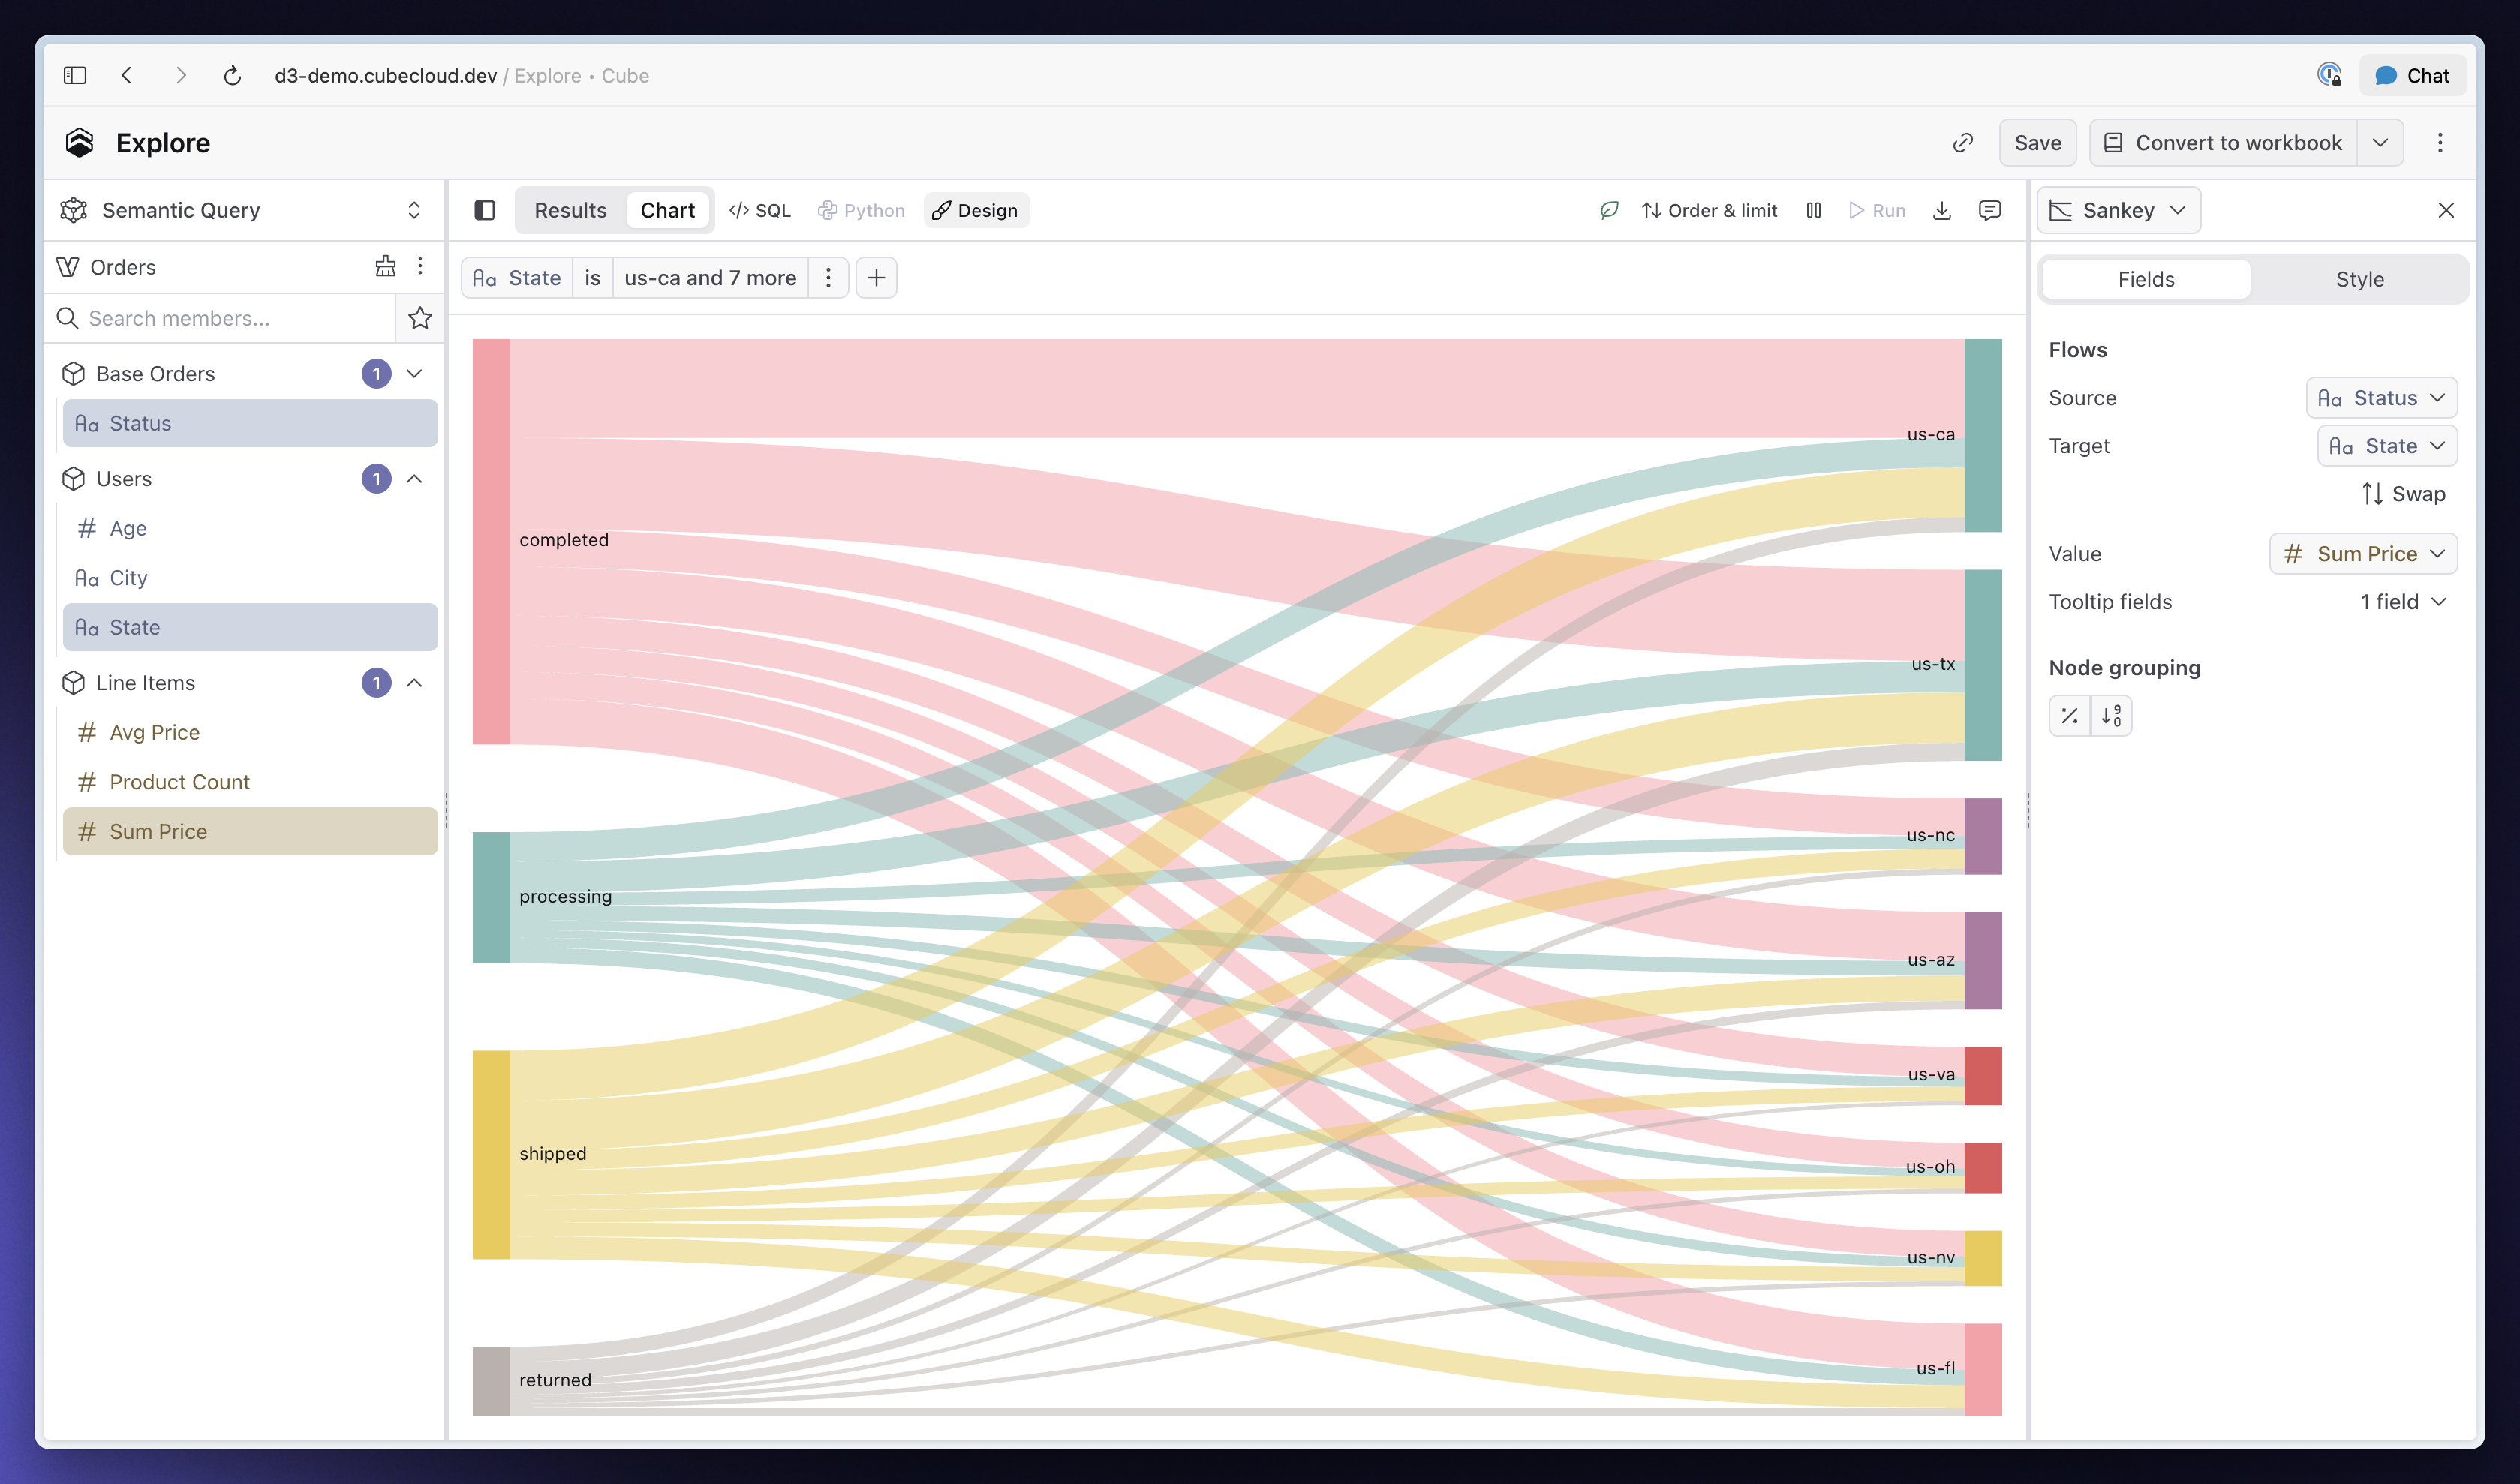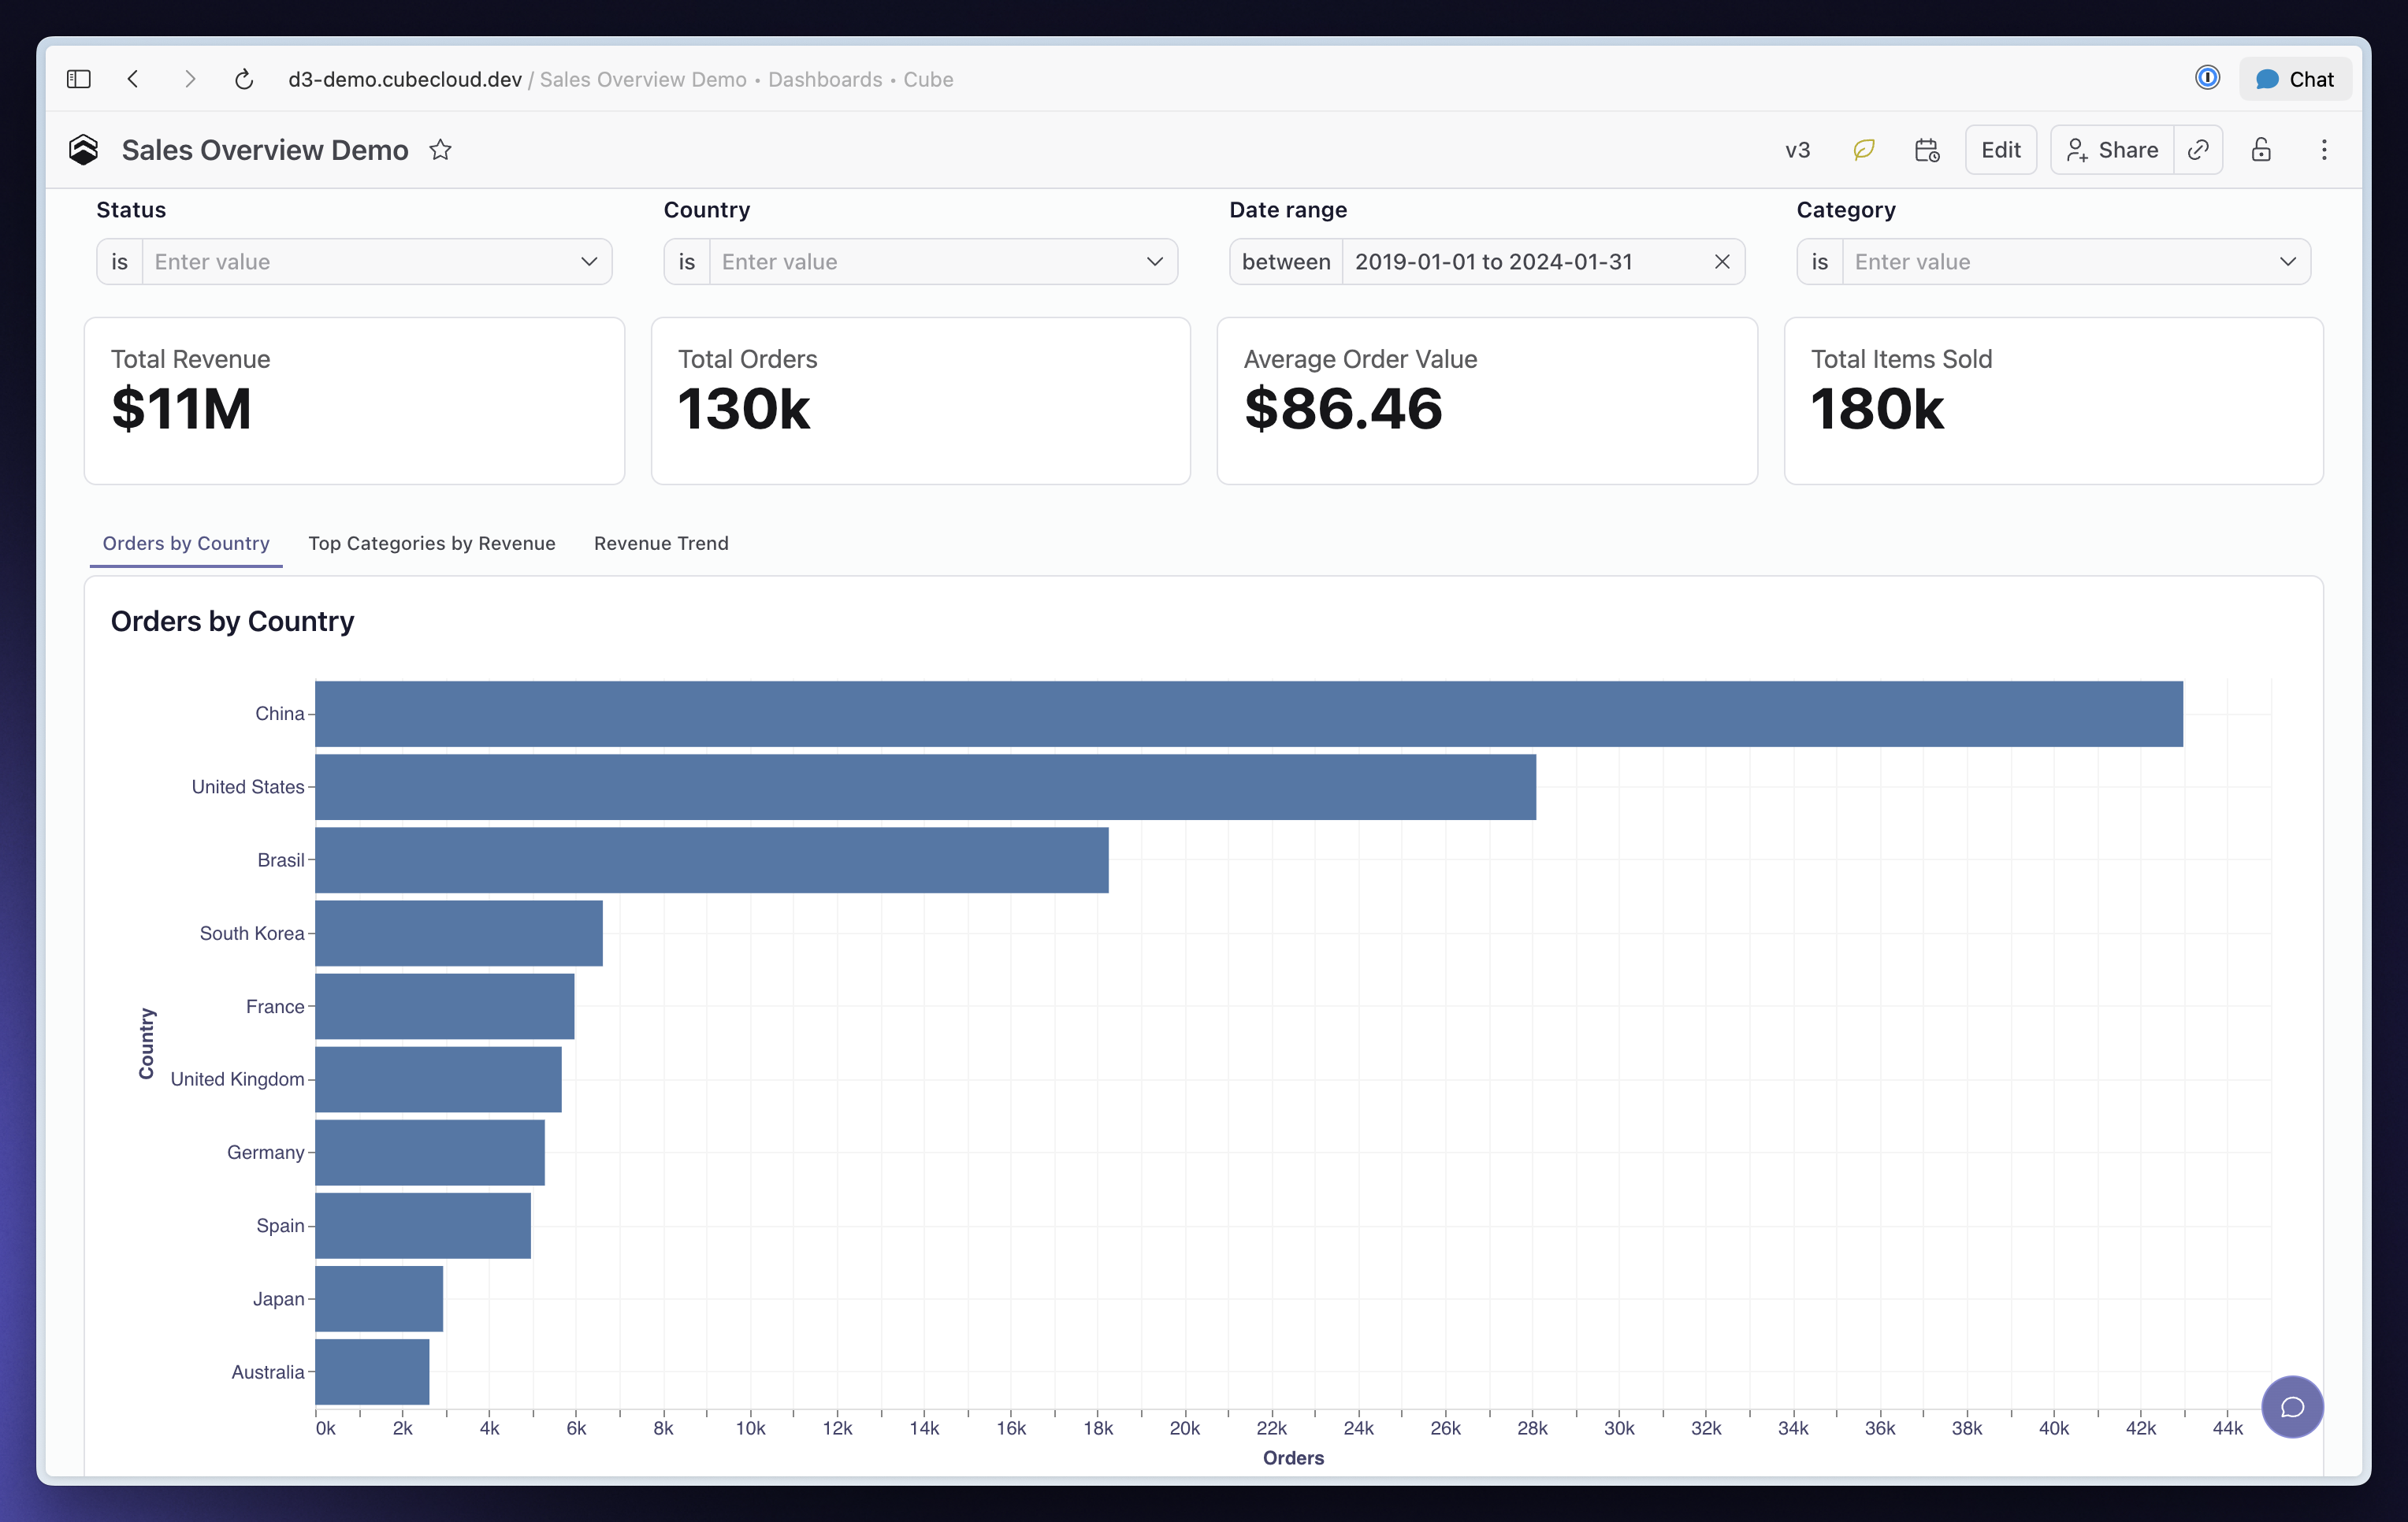
This week we shipped a lot of updates to charts and visualization — a new way to lay a chart out, a rebuilt pie, richer table formatting, and more control over how values look. Most of it lives in the chart settings panel you already use.
Small multiples splits a bar, line, area, or scatter chart into a grid of panels, one per value of a dimension you pick under Split by. Panels can share an axis scale or get their own, so you can compare magnitude or shape.
Pie charts got a rebuild. A slice can now show what percent of the total it is, right on its label. A shape control turns any pie into a donut. And a query with two or more dimensions draws as concentric rings — one ring per dimension, each broken down by the ring inside it — where before every dimension past the first was silently dropped.
On the Table chart, a dimension's links now open straight from the cell value instead of the context menu. Conditional formatting can mark a cell with an arrow, dash, or dot in its own color, so you can see at a glance which rows beat their target. And cell values can be aligned to the top, middle, or bottom of a row, which starts to matter once rows wrap onto more than one line.
KPI blocks can be styled one block at a time — value color, background, and font size. And a reference line can carry a text label, so a target line says what it is on the chart itself.
Other improvements and fixes:
Workbooks
You can now filter a time member by calendar period — in the month, in the quarter, in the year, and their negations — on the report bar, the dashboard filter widget, and embedded Dashboards
Period-over-period comparison can now anchor to a time dimension the query only filters on, so a report with no time column still compares against the preceding window
An Explore chat thread now has its own URL, so you can link someone straight to the conversation
The Generated SQL tab now lists the queries for every data source
Dashboards
Filters you change on a published Dashboard are now reflected in the URL, so a filtered view can be bookmarked or shared
You can now rename a dashboard theme from its menu
The dashboard slug is now shown next to the title in the builder
Fixed the freshness indicator being invisible on stylized Dashboards
Visualization
Fixed conditional-formatting colors reading inverted in dark theme
Fixed Table chart data bars not rendering on a numeric dimension
Fixed a pie chart failing to regroup when its slice dimension is removed
Fixed KPI change colors being ignored on published and embedded Dashboards, so a KPI already saved with them now renders the way it was configured
Fixed KPI HTML blocks keeping their light-mode colors in dark theme when the color comes from row data
Administration
Added a workspace-wide time zone policy under Admin → Settings, with a personal override in Preferences, so time dimensions bucket and relative filters resolve in the zone your readers actually work in (off by default)
The deployment you are in is now marked in the deployment switcher
You can now filter the user groups list to system groups
You can now edit or delete the demo data source
Fixed view-only users being offered workbook edit access they cannot use
AI
Analytics Chat now answers in your workspace time zone rather than always in UTC, so "orders today" stops straddling the wrong midnight
Added GPT-5.6 Sol and Terra, and fixed Cube-hosted GPT selections other than GPT-4o falling back to GPT-5
Added MCP tools for branch diffs, pre-aggregation build status, and deployment environment variables
Cube Agent Skills now apply inside the MCP chat tool
Agent spaces are now scoped to a deployment, so dev, staging, and production can each declare the same space name and get their own
Asking a data question now saves its result into the empty tab it was asked from
The agent now duplicates a view-only Dashboard before editing it, instead of failing
Embed
You can now set a time zone per embed instance with ?timezone=, at runtime from the host page, or as an account-wide default under Embed → Settings
A crashing widget no longer takes down the whole Dashboard, and the AI widget no longer errors on embedded surfaces
Fixed the embedded Creator Mode app reloading when a plan check ran
Integrations
Compact numbers now reach the sheet as numbers rather than text in the Google Sheets and Excel add-ons
Fixed Google Sheets converting text values into dates
Modeling
You can now create a branch from an explicitly chosen source, including a branch that only exists on your remote
Fixed Review changes in a dbt sync email opening an empty diff instead of the branch changes
Fixed two measures on the same cube being refused when they need different join paths
Fixed a multi-stage measure with its own filter returning extra rows that carried null values for every other measure
Fixed FILTER_PARAMS failing to resolve member references inside a column callback
Fixed ungrouped queries being answered from a pre-aggregation that collapses rows
API
cubeSql() and cubeSqlStream() in @cubejs-client/core now accept a timezone option
Fixed the last-refresh time going missing from SQL API responses that use post-processing or SQL pushdown
Forecasts with confidence intervals, regressions, significance tests — the analysis SQL can't express — now run inside Cube. With Python Analysis, a Workbook tab can carry a Python script alongside its semantic query: the script reads the query results as data.csv, writes a chart to output.json, and runs against a sandbox with pandas, Prophet, and the rest of the scientific stack pre-installed. Because the input comes from your semantic model, a forecast uses the same governed metric definitions as every dashboard.
You don't have to write the code yourself — ask Analytics Chat to "forecast next quarter's revenue" and the agent writes and runs the analysis, reaching for Python only when SQL genuinely can't answer the question. The script and its results are saved as part of the workbook, so a Python-backed report can be published to a Dashboard, re-run on view, and filtered by dashboard filters like any other chart — including on embedded surfaces. Read more in the announcement.
Internationalization
Cube now speaks your team's language. The interface is fully translated into 12 locales — English, German, Spanish (Spain and Latin America), French, Italian, Japanese, Norwegian Bokmål, Portuguese (Brazil and Portugal), Swedish, and Vietnamese — across Workbooks, Dashboards, Analytics Chat, the Data Model IDE, administration, sign-in, and transactional emails. Dates, numbers, and day names follow the same locale, so a report reads the way its audience expects.
Each person picks their own language from the Language picker in Preferences, and it follows them everywhere, including the emails Cube sends them. For embedded analytics, set an account-wide default under Embed → Settings, override it per embed with ?locale=, or switch it at runtime from the host page.
Other improvements and fixes:
Workbooks
Freshness and refresh are now one control in Workbooks and Dashboards: hover to see when data was last refreshed and where it came from, and refresh a single chart or every chart on a board from its popover
Added is empty and is not empty filter operators, distinct from the existing null checks
You can now turn period-over-period comparison on for every measure at once from the time dimension column
Nested view groups in the Explore sidebar can now be drilled into and back out of
Dashboards
Charts on published Dashboards now offer Edit in Workbook to anyone with edit access to the backing workbook
Restoring a published version now restores the full Dashboard state
Duplicating a workbook now preserves its chat history, and the copy starts unshared
Scheduled refreshes that fail to register are now surfaced instead of failing quietly
Visualization
Added a circular ring style to the KPI Progress block
KPI Progress bar and Sparkline blocks now accept a per-block value format
Reworked the Table chart's Style tab with compact toolbars and icon toggles
You can now hide a category from a chart by clicking its legend entry
Fixed Table chart heat maps scaling from row totals and subtotals instead of real cells
Administration
Groups can now be assigned roles directly from the console (in preview)
You can now move or delete workspace items and activate, deactivate, or delete users in bulk, from the UI or the public API
AI
Chat on a published Dashboard now offers the same editing actions as chat in a workbook
Asking for several metrics at once now produces a separate KPI widget for each one
Long-running MCP chat calls no longer time out while the agent is still working
Embed
Fixed the AI Summary widget failing to load or regenerate on embedded Dashboards.
Integrations
Date columns with a time grain now keep their formatting in the Google Sheets and Excel add-ons
Large reports are now written to the sheet in chunks, so big exports no longer fail
Everything you can do in Cube is now one command away. The Cube CLI is a single native binary that puts Cube's full public API in your terminal: creating and monitoring deployments, editing data model files, working with branches and commits, linking GitHub repositories and triggering builds, managing workbooks, explorations, and notifications, and administering users, groups, policies, SSO, and agents.
Install it in a single line on macOS, Linux, or Windows and sign in with the OAuth device flow — no passwords typed into a prompt. Every command supports JSON output, deterministic exit codes, and thorough --help, and deploys hash your files so only what changed is uploaded. That also makes the CLI the most reliable way to hand Cube to an AI agent: it's all text in, text out, so an agent can chain a whole workflow without a human in the loop. The CLI is in preview — read the full story in Power of CLI.
Period-over-Period Comparison
You can now compare any measure against a prior period directly in Workbooks and Dashboards. Pick a comparison window and charts, totals, and the results grid all render the current and prior values side by side, with the companion SQL available whenever you want to check the math.
Other improvements and fixes:
Workbooks
Cube descriptions are now shown in Explore
Nested folders inside views are now preserved in Explore and the Playground
Added an Auto Run setting to deployment Model Configuration to control whether Explore and Workbooks run queries automatically
Dashboards
Scheduled Dashboard emails now include a one-click unsubscribe link
Fixed the Dashboard Refresh button not rebuilding stale pre-aggregations before reloading
Visualization
Truncated Table chart cells now show their full value on hover
Measures and dimensions now render with their semantic icon and color in chart settings
Administration
Azure is now available on self-serve plans, alongside AWS and GCP.
AI
Admins can now filter Chat History by where the conversation came from
The model agent now writes drill-down members when it generates cubes, so drilling works on generated models
Embed
Added a setting to hide the AI chat panel on embedded Dashboards, account-wide or per session
Embedded Analytics Chat users can now reopen their past conversations from a Chat History menu
Integrations
Added a workspace quick-find to the Google Sheets and Excel add-ons for jumping straight to a report
Exported reports now list the filters that were applied to them
Modeling
Added Databricks and Athena support to dbt project sync
You can now link straight to a specific branch in the Data Model IDE, with a copy-link button to share it
API
Added public REST endpoints for the GitHub integration, so you can link a repository and create a deployment from it end to end without opening the UI.
Workspace
Workspace search is now a dropdown that groups folders, workbooks, and explorations and shows where each result lives
Transactional emails are now sent in the language set on your profile
Connect your dbt project once and every model becomes a governed cube. The dbt integration converts dbt models into cubes — dimensions, measures, column descriptions, primary keys, and joins inferred from dbt relationship tests and foreign-key constraints — so you never redefine your transformations by hand, and dbt stays the single source of truth.
Sync however fits your workflow: pull manually from the IDE, call the REST endpoint from CI right after dbt run, or trigger on every push with a webhook. Every automated sync lands on a review branch that a human approves before it reaches production. Cube connects to your repository over HTTPS or SSH deploy keys and only ever parses your project — it never touches your data warehouse. Read more in the announcement.
Other improvements and fixes:
Workbooks
You can now drill down on a time dimension in Workbook Table charts and the results grid
Introduced a new-tab experience that lets you quickly start an exploration from a single launchpad: browse or search your semantic model and source tables, or duplicate any existing workbook tab
Dashboards
Read-only viewers of a published Dashboard can now subscribe to and unsubscribe from its scheduled refresh notifications
Scheduled refresh email notifications can now be sent to user groups
Visualization
Added a unified, context-aware color selector shared across chart series, maps, and conditional formatting
Fixed chart dates not matching the results table by anchoring chart time values to UTC
Administration
Added a tenant-wide setting to restrict CSV downloads, plus a deployment-scoped Download Data permission for custom roles
Added a deployment-scoped Manage secrets permission to grant access to one deployment's configuration and credentials without exposing others
You can now select historical Cube versions in any release channel
AI
The Cube MCP server can now edit the semantic data model, not just read it — external agents can open a dev branch, write model files, and commit changes for review.
Embed
Creator Mode embeds can now hide the Semantic SQL and Generated SQL views, so embedded end users can't see your data source's table and schema names.
Integrations
You can now search reports and folders by name in the Google Sheets add-on
Users with access to a shared report can now refresh and place it in the Google Sheets and Excel add-ons, even if they didn't create it
Answering the same question every Monday morning shouldn't depend on someone remembering to ask it. With Scheduled Tasks, you save an agent prompt once, pick a cadence — hourly, daily, weekly, monthly, or a custom cron expression — and Cube runs it on schedule: querying your semantic layer, creating and updating reports and dashboards, and emailing results to workspace members.
Every run produces its own thread in Analytics Chat, so you can open any past run and ask follow-up questions in context, and each task's detail page shows its run history at a glance. Tasks run under the security context of the person who created them, so results respect row-level security and access policies. Create one from the new Scheduled section in the sidebar — or simply ask the agent in Analytics Chat to set it up for you.
Other improvements and fixes:
Workbooks
Added subtotals to pivoted tables: turn on Subtotals in the totals menu and every pivot group gets its own "Total for" column, computed by the database so non-additive measures stay correct
Fixed the fill in missing rows option resetting the query's sort order
Dashboards
Creators can now edit a published dashboard directly from its chat — ask the agent to add a chart, change filters, or adjust the layout, and it updates the draft; an Open in builder button then carries the conversation into the builder so you can review and publish.
Visualization
You can now display a numeric column as a sparkline in Table charts, rendering the measure as a mini line, area, or bar chart over time
Added a freshness indicator to charts in Workbooks and Dashboards: a leaf icon that shows how long ago the served data was refreshed
Fixed Table charts ignoring date formats set in the Results tab
Fixed a brief no-data flash while a Table chart loads
Administration
Chat History in the admin console now labels where each conversation originated: Web, Slack, MCP, API, or a scheduled task.
AI
Added Claude Sonnet 5 support, both as a predefined model and for BYOM
The Auto agent now uses Claude Opus 4.8 for data modeling
The Cube MCP server now includes read-only searchDataModel and runQuery tools, so external agents can explore the data model and run governed queries directly
Analytics Chat can now build map charts
Custom MCP connectors now support API key, Basic Auth, and custom header authentication
Embed
Deployments can now authenticate Chat and embedding API requests with their own Cube authentication (JWT/JWKS) instead of a separate embed token, via a new deployment setting.
Modeling
dbt pull can now generate joins between cubes, inferred from dbt relationships tests and foreign-key constraints
You can now select which branch of your dbt repo to sync, and dbt connection settings moved from environment variables into deployment settings
View-level default_ui_filters now accept relative date ranges (like "5 weeks ago" to "today") and use the same operator vocabulary as the workbook filter bar
Workspace
You can now rename a workbook from its context menu in the Workspace.
Renaming or deleting a field in the data model can silently break saved reports and dashboards that reference it — and you usually find out from the people whose charts stopped working. Content Validator, a new tab in Data Model IDE, scans your saved content and flags every report that references a measure, dimension, or view that no longer exists.
Validation is branch-aware: run it in dev mode or on a shared branch to see exactly which reports a model change would break before it merges. For each broken draft report you can jump straight to it, replace the missing member with a valid one, or delete the report; published dashboards link back to their drafts so you can fix and republish.
Other improvements and fixes:
Workbooks
Added a fill in missing rows option so time-series charts render every date in a range, even ones with no data.
Dashboards
Report widgets in the dashboard builder now keep their title and settings menu in every state, so you can fix or replace a broken or slow-loading widget without deleting it
Time-granularity controls now automatically apply to every chart from the same view, matching how dashboard filters work
The filter sidebar now organizes views into view groups, matching the Data Pane
Fixed a layout flicker when a dashboard first renders
Visualization
Added border controls to the Table chart: horizontal, vertical, header, totals, and outer borders, each with its own color and width, plus one-click presets
You can now set per-column widths on the Table chart, with fixed and flexible modes and fit-to-content
Administration
You can now scope an API key to specific public API endpoints
You can now change your password from the Preferences page
AI
Expanded the Cube MCP server beyond the chat tool: external agents can now create, update, and publish dashboards
Added Slack to the MCP connectors available to the Cube agent
The Cube MCP server now supports allowlisting custom OAuth redirect URIs, so hosted AI tools like Portkey and n8n can connect
Embed
Your app can now listen to typed iframe events from embedded surfaces (ready, view, download, drilldown, AI query) and drive them with actions like setting the color scheme or a filter
Creator Mode embed users can now share workbooks, folders, reports, and dashboards with embed user groups
Embedded surfaces can now be localized into 12 languages, and Creator Mode workspace titles can be set per language
Integrations
A report can now be placed in multiple spreadsheets at once in the Google Sheets and Excel add-ons, refreshing independently in each
Fixed report editor issues in the Google Sheets and Excel add-ons, including pivot zones overflowing when a query has many fields
Cube Evals brings deterministic accuracy checks to your Cube agent. Pair natural-language questions with known-correct answers, run the agent against that suite, and get an objective accuracy score plus a per-case breakdown of what failed. Grading compares result sets directly — it tolerates numeric variance and ignores column aliases — so there's no LLM judge, and every failure shows the agent's SQL next to the ground-truth SQL.
Eval cases live as YAML in your data model repo, so you can run them on a branch in front of a code review, inside AI Studio. Read the full story in Introducing Cube Evals.
Dimension links
A number on its own is a dead end. Add links to a dimension in your data model and they appear as actions in the menu that opens when you left-click any results-table cell — so a reader can jump straight from that number to the context behind it. There are two kinds:
Dashboard drill-ins navigate in-app to another dashboard, auto-filtered by the clicked row — for example, "View Customer" opens that customer's profile dashboard.
External links open a per-row URL in a new tab, so you can deep-link into a CRM, docs, or a search.
Other improvements and fixes:
Administration
Added a Boolean user attribute type — a True / False / Unset toggle — across user attributes, per-user values, and the security-context override editor
AI
The agent now warns when a query's results are truncated to 100 rows
Fixed the agent occasionally saving a dashboard report with no chart
Embed
Added an Embed preview playground for admins to test chat, dashboard, and Creator Mode embeds
Create embed tenants directly from the admin Embed section
Embedded surfaces, including Creator Mode, can now be localized to Spanish
Fixed a crash in embedded dashboard agent chat when the agent returned SQL
Export embedded dashboard widgets as CSV
Modeling
Review a dev branch's unsaved and uncommitted changes from anywhere in dev mode, and revert individual files
A number tells you something moved; the reason usually lives in a ticket, a doc, or an error tracker. With MCP Connectors, the Cube agent can now reach the external tools your team already uses — and pull that surrounding context into the same conversation, while every answer stays grounded in your semantic layer. We're launching with Notion, Linear, Sentry, and Attio, with many more connectors on the way — and you can already point to any remote MCP endpoint with a custom connector today.
Ask "activation dropped last week — what changed?" and the agent can combine the metric with the features that shipped and the errors that spiked. It works both directions: results can be written back as a Notion page, filed as a Linear ticket, or posted wherever your team works. Set up connectors from the connector directory; administrators choose exactly which tools the agent can use — nothing is enabled by default — and every connection respects your existing access controls.
Each user connects their own accounts: connectors that need a personal login are authorized per user and can be reviewed or revoked from Connected accounts in your preferences. Read the full story in Introducing MCP Connectors.
Other improvements and fixes:
Workbooks
The SQL Runner is now available in Explore, not only in Workbooks
Semantic view hierarchies now render in Explore
You can now delete a workbook directly from the workbook page
Workbook widgets now show structured, readable query error messages
Dashboards
Added a Duplicate action to the dashboard and workbook builder menus
Dashboard builder filter and time-granularity pickers now show dimension type icons
Visualization
Added color scale (heat mapping) for the Table chart, so cell backgrounds shade by value
The Table chart can now render values as in-cell data bars with a Display as control
Administration
Added a SQL Runner permission to the custom role builder so you can control who can run raw SQL
AI
The Cube agent can now search the web and read linked pages, bringing current, real-time information into the conversation alongside your data
The Cube agent can now email members of your workspace, for example to send analysis results or a summary
Embed
You can now share a Creator Mode dashboard with a specific embed tenant, not only with all embed users
Integrations
Semantic view hierarchies now render in the Google Sheets and Excel add-ons
The Google Sheets and Excel add-ons now follow your light and dark theme
Modeling
The Security Context tester now has an Advanced mode for overriding Cube Cloud groups and user attributes, so you can preview exactly what any user or group sees across Explore, Workbooks, Dashboards, and Chat
The new Usage Analytics page gives account administrators a set of pre-built dashboards that show how your deployments are used: query volume and latency, cache efficiency, user adoption, and AI activity with token consumption. Each dashboard answers a different question about your account — Overview, Query Activity & Performance, Users & Adoption, and AI & Token Tracking.
Usage Analytics is itself a Cube application: your account's usage telemetry is modeled as a curated set of views — API Requests, AI Usage, and Users & Adoption — and the pre-built dashboards are regular Cube dashboards on top of them. It runs the full Cube experience in Creator Mode, so you can explore the usage data, create workbooks, and assemble your own dashboards — anything you build stays private unless you share it. Available on Premium and above plans.
Other improvements and fixes:
Workbooks
Column and row totals enabled on the Results tab now carry over when you switch to the Table chart
Fixed the run options menu being disabled on new empty queries, which made the Auto-run toggle unreachable
Dashboards
Scheduled dashboard emails are now rendered per recipient: each recipient gets the dashboard refreshed and captured under their own security context
Fixed time range filter drag and navigation bugs on the monitoring pages
AI
Added Claude Fable 5 support for the agent LLM selector and BYOM
Fixed agent-built line charts sometimes rendering as an empty "Configure your chart" state
New conversations now appear in the Chat History dropdown immediately
Stopping a chat response now settles the UI right away, and follow-up messages send normally
Fixed the MCP Server endpoint URL for deployments in dedicated and BYOC regions
Embed
Creator Mode users can now duplicate dashboards shared with all embed users and build on top of them
Rename or hide the embedded workspace title from the App Theme page
Integrations
Added least-privilege mode to Semantic Layer Sync for Tableau Server and Tableau Cloud
Modeling
Views can now declare default workbook filters via meta.default_ui_filters — selecting the view in a new workbook pre-populates them as editable, removable filters
Workspace
Raise a collaborator's inherited access on a subfolder directly in the share dialog
Agent Skills let teams capture repetitive analytical workflows as reusable, named procedures that the agent runs consistently every time — across Analytics Chat, Workbooks, and Dashboards. Instead of re-explaining the same multi-step analysis each time, you define it once and the whole team runs it the same way.
There are three ways to invoke a skill: click its button in chat, type / for a slash menu filtered by title and description, or just ask in plain language and the agent matches your request to the right skill and runs it. Once you've picked one, you can refine it inline — "for EMEA, last 6 weeks" — and the agent adjusts the run accordingly.
Skills are authored as plain Markdown files in your project's agents/skills/ directory: frontmatter plus plain-language steps, no special syntax. Running a skill is available to Explorer and Viewer roles; authoring one requires data-model edit permissions. Read the full story in Introducing Cube Agent Skills.
Other improvements and fixes:
Workbooks
Stop and cancel running queries from Explore and Workbooks
Disable auto-run in Explore and Workbooks
Reworked the Table chart's Fields tab — separate visibility and labeling controls, plus a 2×2 pivot grid (columns/rows/values)
Rename a Workbook by double-clicking its title
Fixed: the semantic view picker in Explore re-opening the previous view instead of the one just selected
Dashboards
Filters fall back to an unfiltered query when a filter doesn't apply to a widget
Dashboards now remember your layout compaction setting
Administration
CSV export on the billing Statements tab
Refreshed the deployment Resources logs view
Per-deployment cloud storage now supports Google Cloud Storage and Azure Blob Storage over OIDC
AI
The Dashboard Agent can now change filters and time granularity
Attach a dashboard chart to the Dashboard Agent as follow-up context
Embed
Fixed a 404 when opening an admin-published dashboard shared with all embed users in Creator Mode
Item owners are now hidden in embed Creator Mode
Integrations
The Google Sheets and Excel add-ons now match Explore formatting for column and row totals (bold totals values)
Added a "Loading data…" marker in the sheet while a query runs
Modeling
The Merge button appears immediately after you commit on a branch
Developers can override the global security context when testing queries
API
Public REST API for notifications
Public API endpoints for managing folder contents
Workspace
Newly created Workbooks now sort to the top of "Last Viewed"