Sankey charts
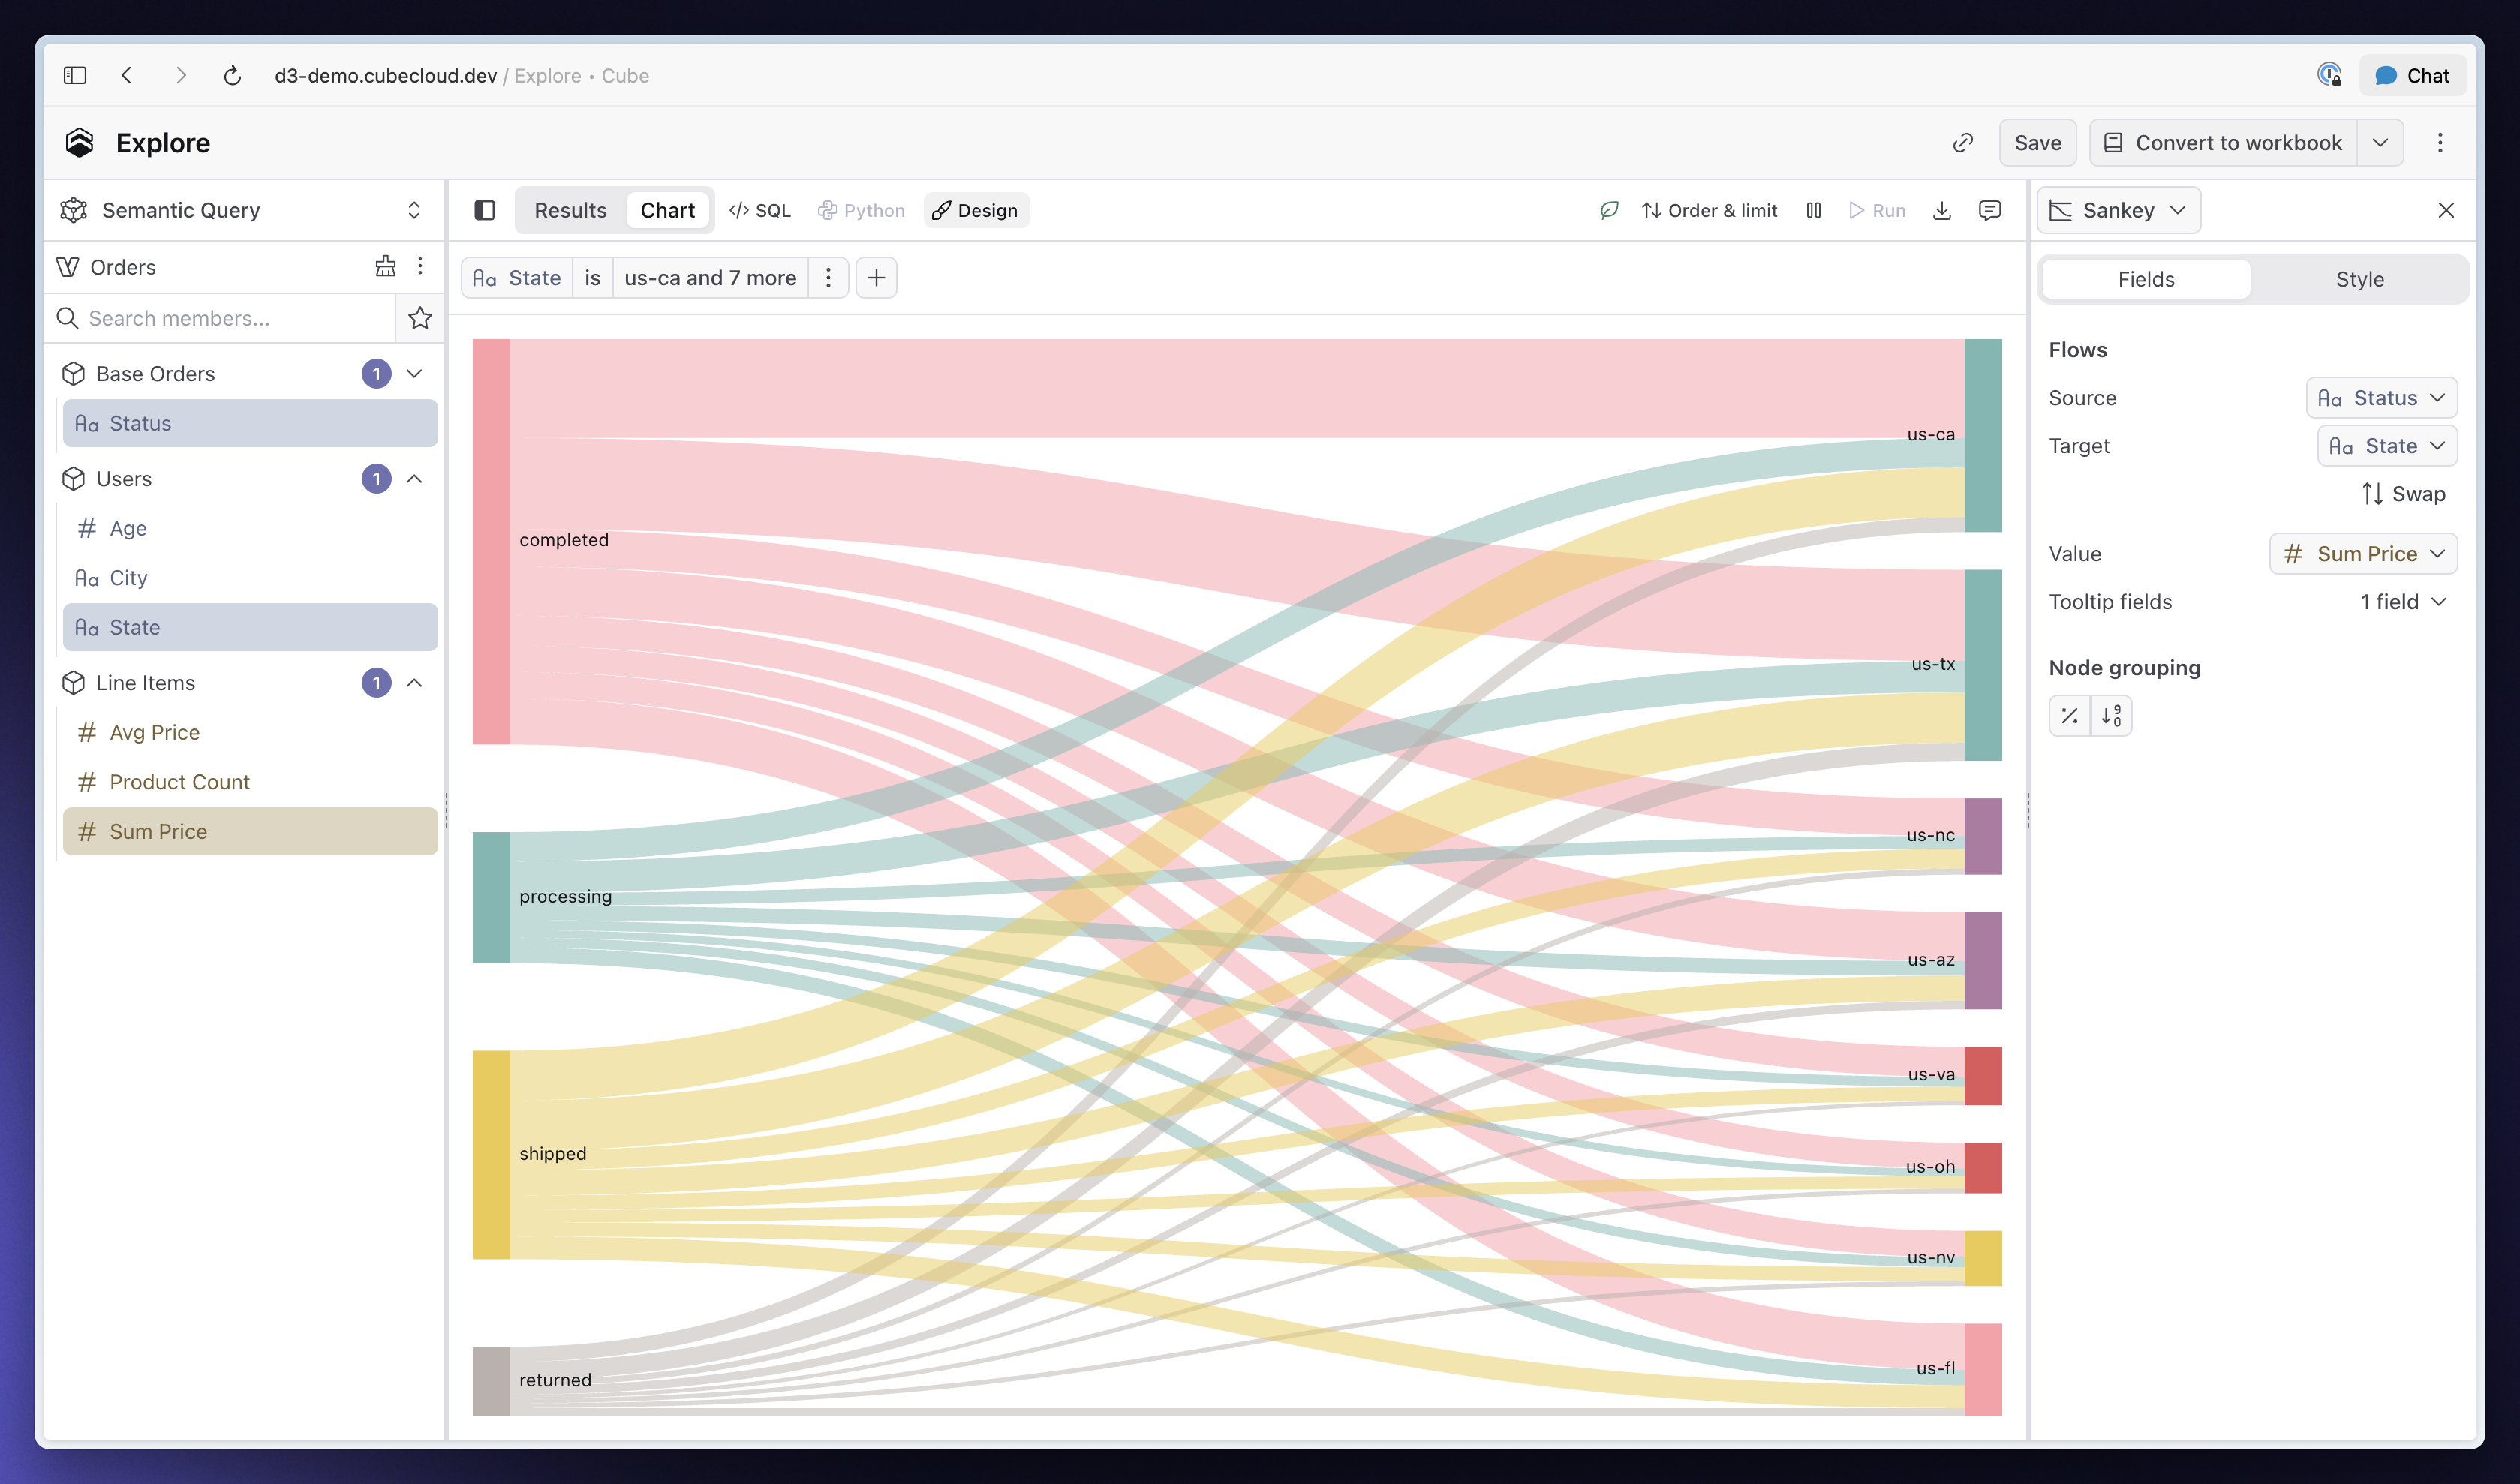
You can now turn two dimensions and a measure into a Sankey chart to show how values flow from one stage to another. Pick the source, target and value fields directly in the chart builder without writing a custom Vega specification.
Cube connects matching values into multi-stage paths, lets you group smaller nodes into Other by share or rank and supports tooltips and drill-down on individual flows. Sankey charts work in Explore, Workbooks and published Dashboards.
Parent controls
You can now add a Parent control to a Dashboard to update multiple Filter and Time Granularity controls at once. Define options such as monthly, quarterly or regional views, then map each option to the child controls it should change.
Viewers get one simple choice instead of adjusting every control separately. Parent controls work in published Dashboards, show which controls they drive and can use a user attribute to personalize the default view.
Other improvements and fixes:
Workbooks
You can now edit calculated fields directly from the Data Pane.
Dashboards
- Scheduled Dashboard notifications can now include an AI-generated “What changed” summary in email and Slack
- Users receiving scheduled refresh emails through a user group can now unsubscribe themselves, while editors get clearer controls for user and group recipients
Visualization
- Added Funnel chart support with tapered stages and optional conversion labels
- Added Table chart support for showing accurate subtotals at every row-group level, including when groups are collapsed
- Fixed Area charts showing nothing when a series contains only one data point
Administration
AI billing insights now have separate AI Usage and AI Requests pages, with searchable spend reporting, request history and clearer billing-period controls.
AI
Analytics Chat can now save a query as a standalone exploration in the Workspace, making it available to the Google Sheets and Excel add-ons.
Embed
- Embedded Creator Mode now supports creating, renaming and deleting folders
- Signed embedding sessions can now renew in place without reloading the iframe
- Embedded Creator Mode hosts can now hide individual Dashboard header controls
- Embedded Dashboards can now export charts as PNG or PDF when
allowExport=true
Integrations
- The Google Sheets and Excel add-ons can now place the same exploration on multiple sheets and keep placements intact when sheets are renamed
- Pivot reports can now put measures on rows or columns, position them before or after dimensions and reorder them
API
The public REST API now exposes dbt sync history and logs, and sync status remains available after workflow retention expires.
Workspace
When duplicating a shared Workbook or Dashboard, you can now choose whether to copy its sharing and embedding settings.